
Very excited to share my new publication! It took us a while but here it is, finally!
The study focused on the July 2019 heat waves in New York City and changes in TNC (Uber, Lyft, Juno) ridership. It compared days when the National Weather Service issued extreme weather messages to normal-weather, same days of the week to see change in ridership related to extreme heat and used fixed effects to analyze variations across low- and high-income areas.
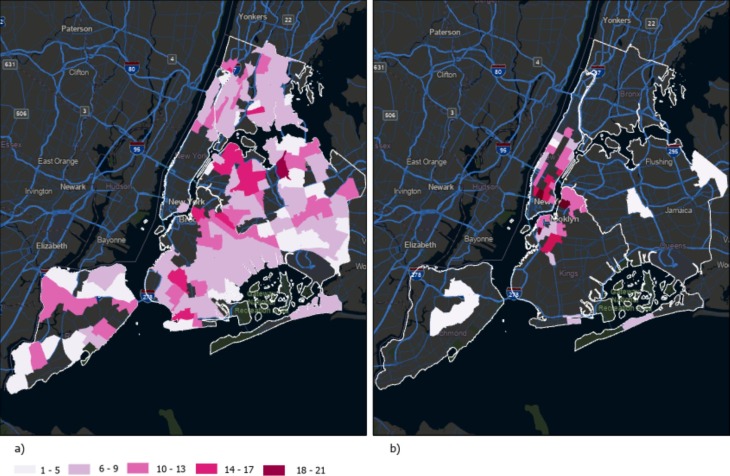
Ridership percentage increase on July 17 compared to the average a) low-income zones b) high-income zones.
Here are the findings:
1. ridership increased up to nine percent on extreme-heat days compared to normal-weather days for the entire city
2. ridership increased by three percent for every $10,000 increase in average per capita income of a neighborhood
3. the impact of the extreme heat on ridership was statistically significant for the period after the coming into effect of the extreme weather message
Article link below 👇
Please cite as below:
Gebresselassie, M., Michalek, J., Nock, D., Harper, C. (2019), Analyzing disparities in app-hailed travel during extreme heat in New York City. Transportation Research Part D: Transport and Environment, Volume 142, 2025. doi.org/10.1016/j.trd.2025.104650
